According to recent research, mid-market companies, particularly those engaged in the service industries, are some of the US economy's biggest drivers. These service businesses can monitor their customer retention, revenue, growth, and customer satisfaction scores using professional services Key Performance Indicators (KPIs), which is a practical and potent business resource. The more development a services business experiences, the more important it becomes to measure the various factors related to such development. For example, you should consider the quality and quantity of what you're trying to monitor. Give attention to specific professional services KPIs you’ll use to evaluate your business growth.
You should use no more than seven to ten key performance indicators for application either at the company level or in a particular department. Going overboard with your KPI for a service company could lead to overthinking and slow decision-making, which the business world calls “analysis paralysis”.
We’ll explain various KPIs for the service industry, explain the importance of each, and give you the formulas to calculate them. Equipped with this knowledge, you’ll be able to choose KPIs for your service business and successfully evaluate the performance.
What Are KPIs for Professional Services?
KPIs for professional services are essential metrics that will help you evaluate the performance, efficiency, and success of your offers, whether it’s consulting, marketing, legal services, accounting, or any other services.
There are many KPIs for service businesses, and which one you’ll use depends on your industry and business goals. We’re going to give you all the information and professional services KPIs to help you decide what to track and analyze to improve your business and drive more growth.
How Do You Set KPI for a Service? Step-by-Step Guide
Setting KPIs for professional services is one of the most important processes you’ll need to go through. Once you have KPIs for your service business, you’ll be able to make sure operations are effective, your business is financially sound, and your overall success. We’ve prepared a step-by-step guide to help you set KPIs for your service business.
- Define business objectives: What’s your priority? Set priorities and focus for your service business. Are you aiming for growth, improved efficiency, customer satisfaction, or profitability? Answers to these questions will tell you which KPIs to set up.
- Identify key metrics: Identify the specific metrics you’ll use to set your service business KPIs that are the most relevant to you. Consider metrics such as revenue, costs, hours, conversions, etc. These metrics should directly contribute to achieving your defined professional services KPIs.
- Set short-term and long-term goals: Establish both short-term and long-term targets for each KPI for your service company. Short-term goals will give you quick wins and immediate progress tracking, while long-term goals provide a bigger picture for measuring success over time.
- Determine data sources: Which data sources will you use to track the progress of your KPIs? You’ll need to identify the data sources and set up a system to collect real-time or near-real-time data. This will help you make smarter business decisions, faster.
- Create baselines: To track progress, you first need to set baselines. These baseline values serve as a starting point against which you’ll measure future progress and growth.
- Assign responsibilities: Assign roles within your service company for tracking, analyzing, and reporting on each KPI. Ensure that individuals or teams have access to the data and tools they need.
- Set measurement timeframes for professional services KPIs: Determine the frequency at which you’ll measure and review professional services KPIs. Depending on the KPI itself, it could range from weekly, monthly, quarterly, or annually.
- Communicate KPIs for your service business across the organization and teams: Communication is once again, the key. Make sure that all relevant employees, managers, and team members know the KPIs, their significance, and associated targets. Effective communication fosters alignment and accountability.
- Implement data collection and monitoring: Automating data collection will help you save time and reduce errors. If possible, you should work on automation as much as you can. Systems and processes to collect and monitor data for each KPI for your service business will make everything run smoother.
- Analyze data and take action: It’s vital to compare actual performance against targets. When a KPI is not meeting its target, you should take prompt action to address the issues. On the other hand, you should also celebrate and replicate success in areas where targets are met or exceeded.
- Review KPIs for your service business: Periodically review your KPIs to make sure they are relevant to your growing business. Adjust or refine them as needed to reflect the change in priorities or market conditions.
KPIs for Service Industry vs. Metrics
Let's clarify the distinction between KPIs and metrics in the service industry.
KPIs focus on specific goals and quantify performance over a defined period toward strategic objectives. Businesses set these objectives, which can range from achieving a quarterly income target to attracting a certain number of new customers per month.
Metrics support KPIs by identifying the strategies and methods businesses need to achieve the objectives set by these key performance indicators. Businesses use these metrics to track and evaluate how well they meet specific goals, such as catalog downloads or store visits.
While a business's financial statements remain relatively stable, its targets and priorities are constantly evolving. This is where introducing professional services KPIs becomes crucial.
A well-structured plan that highlights these KPIs and metrics, in conjunction with your financial reports, accomplishes three essential objectives for your business:
- Ensures that businesses assign responsibility and accountability for fundamental goals.
- Sets expected outcomes based on assessable data, which informs decision-making.
- Establishes a connection between your financial information and administrative processes, allowing businesses to transform short-term priorities into long-term objectives.
30 Professional Services KPIs Examples With Formulas by Category
- Operational KPIs for Service Business
- Professional Services KPIs for Project Management & Resource Optimization
- Marketing & Sales KPIs for Professional Services
- Professional Services KPIs to Improve Customer Loyalty
- KPIs for Professional Services for Higher Profitability
4 Operational KPIs for Service Business
Utilization by Employee
Do you know how effectively your employees utilize time and resources on a billable project? This service business KPI will provide you with insights into the productivity and efficiency of individual employees in your company.
How to calculate utilization by employee: (Billable Hours by Employee / Total Workable Hours by Employee) x 100
Employee Turnover Rate
Employees are the lifeblood of service businesses. Because of that, it might make sense for you to measure the percentage of employees who leave over a specific period. It reflects the attrition within your service company, and this can have significant implications for project continuity, client relationships, and overall operational efficiency.
A high employee turnover rate signals some issues such as employee satisfaction, company culture, or bad talent retention strategies. This can negatively impact service quality and client trust.
How to calculate employee turnover rate: (Number of Employees Who Left / Total Number of Employees) x 100
Employee Satisfaction Score
Employee satisfaction score is another important KPI for service businesses as it measures the content and engagement of your employees. Typically, you can access employee satisfaction through surveys, or regular assessments.
Effectively managing and improving employee satisfaction is essential for creating a positive work environment and making sure employees stay motivated to deliver their best work, which ultimately benefits your service business, clients, and employees.
How to calculate employee satisfaction score: Sum of Employee Satisfaction Scores / Number of Employees
Annual Overhead Per Billable Team Member
This is a standard professional service KPI that determines the revenue per billable team member to offset operational costs. It falls under the process category and correlates to the KPI for revenue per billable team member. You divide the trailing 12-month overhead costs (what it costs to run the business apart from team member costs) by the number of billable team members.
You can find out what it costs to run your service company, and it's a vital KPI for any startup wanting to evaluate the effect a new hire can have on overhead expenses. This performance indicator is fundamental in setting the billable rate for team members. Its progression is key to identifying if your company's effectiveness is advancing and if there is an increase or decrease in revenue as it relates to the growth of your business.
How to calculate annual overhead per billable team member: Annual Overhead Per Billable Team Member = Annual Overhead Costs / Number of Team Members
5 Professional Services KPIs for Project Management and Resource Optimization
Time Utilization
You can apply time utilization KPI to either team members or fiscal performance. It involves noting the number of hours each team member spends on billable projects and dividing it using the overall hours left available.
This key metric helps you to better comprehend the overall welfare of your team and the company's productivity levels.
Professional services organizations consider this metric to be vital for performance management, resource planning, and establishing a pricing method, among other things.
Companies occasionally apply a specific point of reference for the denominator shown in the equation below. The standard point of reference ranges from 1,800 to 2,100 for the amount of possible billable hours per year. It is regularly determined by the company itself or by the industry in which it operates.
How to calculate time utilization rate: Time Utilization Rate = Billable Hours / Total Work Hours
Scheduled Billable Hours
This service KPI informs you of how busy billable employees are expected to be. The key to this is being proficient in scheduling and supervising all projects and resources within the company.
If you combine this with utilization tracking, you gain a better understanding of the predicted revenue per billable consultant. It also helps delivery organizations know what to sell and when to launch such an operation.
Average Project Completion Time
Time is a valuable resource, and time management is a priceless skill. Because of that, the average project completion time is a valuable KPI for any service company. It measures the average amount of time it takes to successfully finish client projects. It assesses operational efficiency and client satisfaction. A shorter average project completion time typically means you have a streamlined and efficient workflow. Once you track this professional services KPI, you’ll enhance your ability to meet client expectations, optimize resource allocation, and drive better project results.
How to calculate average project completion time: Total Project Completion Time / Number of Projects Completed
Stay on Top Of Your Professional Services KPIs with Trafft
Staying organized has never been easier.
You can now manage your business and grow your brand with a single, powerful software that keeps all of your appointments in line, your clients organized and your business booming.
Trafft is perfect for business owners who need to streamline their booking experience both for their staff and their clients.
Trafft handles everything for you, even sending automated email or SMS reminders to your clients. No-shows? Not anymore!
With the insightful business dashboard, you can collect and analyze data and stay on top of your service business KPIs.
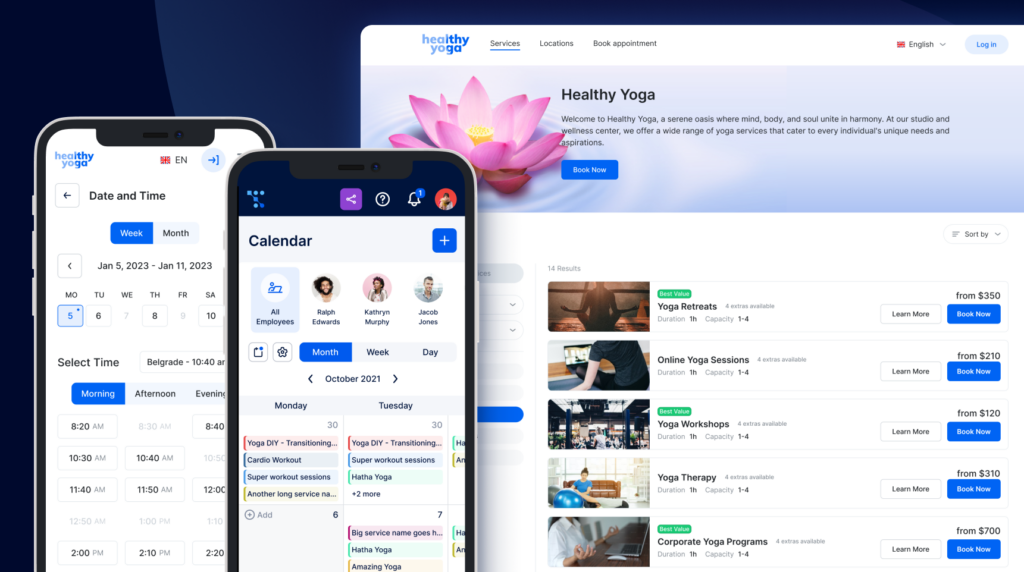
The Trafft booking software adapts to different industries for a blissful online booking experience and employee management.
Want to know more? Check out Trafft's awesome features to see what you are missing.
Sign up for Trafft - it’s free for up to 5 members, and you get amazing features to help you supercharge your business growth and efficiency.
Average Resolution Time
How long does it take you to acknowledge concerns and requests from clients? How long will it take to iron out those issues? Both are equally important, but clients prefer a low-resolution time to a low response time. Three days is considered average, but the top 20% have resolved problems in less than two days.
Quick resolution time is important if you want to maintain your reputation and build good client rapport. A client who can rely on you will support your company instead of taking their business to another MSP competitor.
Backlog
Good management of incoming projects allows for a service business to expand consistently with each fiscal year. As more projects are taken up, a backlog can occur. It is vital for a business to manage this key performance indicator well.
A backlog includes service projects and income that the team is currently working on or that have been put on hold for a time. Understanding a backlog in real time gives your team the data they need to plan for both current and future projects. They can also make decisions related to important processes, such as who to hire for the job.
9 Marketing & Sales KPIs for Professional Services
Client Acquisition Cost (CAC)
CAC measures the cost you pay to acquire a new client in your professional service company. It includes expenses related to marketing, sales, and client acquisition efforts. The lower the CAC, the better. It means you have effective client acquisition strategies. This is crucial to improve profitability and ensure positive ROI.
How to calculate CAC for professional services: Total Sales & Marketing Expenses / Number of New Clients Acquired
Marketing Qualified Leads (MQLs)
It’s not enough to get leads. You have to get leads who are highly interested in your professional services. They may not be ready to convert into clients immediately, but identifying and nurturing MQLs is essential. They are the people who are most likely to become your clients, and tracking MQLs will improve your lead management and conversion rates over time.
How to calculate MQLs: MQLs = Number of Leads Meeting MQL Criteria
Website conversion rates
Depending on what you expect your website to achieve, you’ll set different conversion goals. For example, for your service business, this can be the number of people who decided to book a call, fill out contact forms, sign up for a newsletter, etc. This professional service KPI reflects how effective your online presence is in attracting leads.
How to calculate website conversion rates: (Number of Conversions / Total Number of Website Visitors) x 100
Lead generation rate
How fast do you generate leads? How effective are your lead generation strategies? Lead generation rate assesses the success of lead gen strategies, such as content marketing, SEO, and advertising.
How to calculate lead generation rate: (Number of New Leads / Total Number of Leads) x 100
Cost per Lead (CPL)
CPL is crucial because it quantifies the cost of acquiring each new lead. It’s vital for effective management of marketing budgets for service companies.
How to calculate CPL: Total Marketing Costs / Number of New Leads Generated
Lead-to-Client conversion rates
This service business KPI measures the percentage of leads that successfully convert into paying clients, and that’s what matters in the end. It reflects the efficiency of your sales process and the quality of your lead nurturing efforts. A higher conversion rate indicates a more effective sales funnel and better alignment between marketing and sales teams.
How to calculate lead-to-client conversion rates: (Number of Clients Acquired / Number of Leads) x 100
Sales pipeline value
Sales pipeline value determines your potential when it comes to revenue and profitability. It’s the value of all potential deals and opportunities you currently have in your sales pipeline. It serves as a forecast of future revenue potential, which will help you with resource allocation.
Sales cycle length
Relationship building is time-consuming and extensive for service businesses. How long does it take you to convert a lead into a paying client? How many touchpoints do you have in between? Determining the sales cycle length and working on ways to shorten it will help you to generate revenue quickly.
How to calculate sales cycle length: (Total Time to Convert Leads into Clients / Number of Leads Converted to Clients)
Win rate
How many of your proposals go to waste? How many win the deal? Win rate provides insights into the effectiveness of your sales team and their strategies, making it one of the most valuable professional services KPIs.
How to calculate win rate: (Number of Closed Deals / Number of Sales Opportunities) x 100
4 Professional Services KPIs to Improve Customer Loyalty
Customer Retention Rate
The percentage of your current customers who return during a particular period is known as your customer retention rate. Having this information helps you to know what keeps your customers coming back and can pinpoint any areas where you could enhance customer experience.
Drawing in new customers can cost five times more than retaining current ones. It's logical from a business growth standpoint to foster strong professional relationships. You want customers to make an effort to engage with your business on a variety of levels. A customer effort score (CES) will help your service teams identify how they can create such brand advocates.
With the competition just one click away (literally), it's become a necessity.
There has been a 22% rise in service organizations that have set customer retention as one of their KPIs. You can avoid losing customers if you follow their example.
How to calculate customer retention rate for the service industry: Customer Retention = Number of Customers at the End of the Period - Number of New Customers Acquired over the Period / Number of Customers at the Beginning of the Period
Client Satisfaction Rate (CSR)
You should ask your clients to provide feedback for your services. Typically, you should give them to fill out feedback surveys and analyze the results.
How to calculate CSR for service business: (Number of Satisfied Clients / Total Number of Clients) x 100
Client Lifetime Value
For professional services, client value varies a lot. The time they work with you also varies. Sometimes you work with clients for years, sometimes it only lasts a month. It depends on multiple factors, but the CLV of each client is an extremely valuable KPI for service businesses.
How to calculate client lifetime value for professional services: (Average Annual Revenue per Client x Average Client Relationship Duration)
Referral Rate
A high referral rate indicates strong client relationships and that your clients aren’t only satisfied, but also willing to recommend your service business to others. It’s a valuable professional service KPI because it can lead to a cost-effective client acquisition channel and organic business growth.
How to calculate referral rate: (Number of New Clients from Referrals / Total Number of New Clients) x 100
8 KPIs for Professional Services for Higher Profitability
Billable Rate
The billable rate is the amount a customer is charged per hour for the service provided by the business and its employees.
Your client will then consent to paying a set price (billable hourly rate) determined by dividing the final amount by the number of hours spent performing the job.
You can then contrast the difference between the actual billable rate and the price initially set. Companies need to understand the necessary principles of billable hourly rate management if they're looking to upgrade that particular detail.
How to calculate billable rate: Billable Rate = Total Revenue / Total Billable Hours
Revenue Per Billable Team Member
This KPI falls under the process category. It helps you to monitor three essential aspects: your team's workflow, productivity, and general profitability. You can work this out by dividing your trailing 12-month (TTM) revenue by the amount of billable team members.
If you're wondering when to hire someone new, merge the data from this KPI with the overall figures related to your utilization rates and sales pipeline.
By monitoring this metric monthly, you'll gain a comprehensive understanding of the developments in the team's productivity and the effect that major projects are having on your ability to deliver what your customer wants and needs.
A general guideline is to have the revenue per billable employee be at least one to two times the cost per billable employee. A company that is providing a quality specialization service might deal with higher totals. For example, legal or management consulting firms can charge up to three times that rate.
How to calculate employee billable rate: Employee Billable Rate = Revenues Billed by Employee / Billable Hours Related to Employee
Project Profitability
This key performance indicator measures the potential money one could earn on a project and the profits and losses from a project. The percentages determined for both profit and margin are employed to indicate the project profitability KPI for a service company.
Each project is different from the next and can have a distinct effect on the general performance and financial status of the business. If a company understands why specific projects brought in a profit or resulted in a loss, they can focus on more promising enterprises. Bypass enterprises that will lead to a revenue deficit.
How to calculate project profitability: Project Profitability = Project Revenues / Billable Hours Related to that Project
Gross Margin Profit
This key indicator works out not only profitability potential but also helps you get control of current projects. If a project’s requirements have become unmanageable (scope creep) or if a project was mispriced due to errors in working out the estimate, this KPI will help you.
When it comes to projects, you can determine if you are allocating your staff efficiently (for example, if more high-priced employees than required are assigned to a low-revenue client). You can see which services are being carried out successfully.
The service industry median sits at 34.5% across a variety of companies, as shown by the research.
How to calculate gross margin rate: Gross Margin Rate = Revenues - Cost of Services / Revenues x 100
Realization Rate
Realization Rate is another crucial metric regarding profitability. To calculate your realization rate, you must divide the number of working billable hours by the number of hours for which the client was charged. Imagine, your company spends 50 hours working on a project, but the contract stipulates that the client be billed for 40 hours. The realization rate is 80% because the client was billed for 40 hours which is divided by what the team worked, 50 billable hours.
This metric is focused on revenue. How many hours can you monetize for the services you deliver? It's a measurement that lets you make the most of a project's profit potential. Use key metrics like this to evaluate project overruns, calculate hours worked but canceled to curtail costs, and scope projects.
How to calculate realization rate: Realization Rate = Number of Billable Hours Worked / Number of Hours Billed to Clients
Return on Investment (ROI)
The return on investment KPI lets you know how much money you make on each investment. The amount of return is often equal to the net profit or revenue. On the other hand, your investment is an aggregate amount of company assets that include real estate, equipment, stock, cash, and the like.
How to calculate the return on investment: ROI = Net Result / Investment x 100
Average Revenue Per Client
Average revenue per client (ARPC) is a key professional service KPI because it provides insights into the value of each deal to your business. The more money each client spends on your services leads to increased profitability.
How to calculate average revenue per client: Total Revenue / Number of Clients
Revenue Growth Rate
A positive revenue growth rate signifies business expansion and better profitability, while a negative may indicate a decline in revenue. Monitoring revenue growth helps you to evaluate the success of your growth strategies, adapt to market changes, and set financial targets for your service company.
How to calculate revenue growth rate: (Current Revenue - Previous Revenue) / Previous Revenue) x 100
FAQs about KPIs for a service company
1. What are the most important KPIs for measuring the performance of a service company?
Depending on the precise nature of the services offered, the most crucial KPIs for gauging a service provider's performance may vary, however, some typical examples are customer happiness, service delivery time, revenue growth, and employee productivity.
These KPIs offer insight into important facets of the company and can be used to pinpoint areas for development and growth potential.
2. How do you determine which KPIs are most relevant to your service company's goals and objectives?
It's critical to first identify the precise aims and objectives of the business to decide which KPIs are most pertinent to the goals and objectives of a service organization.
Once these have been determined, it is crucial to determine which metrics relate to these goals and objectives and can offer useful information about the performance of the organization.
The best KPIs can be chosen by conducting a SWOT analysis, looking at industry benchmarks, and talking to stakeholders.
3. How can KPIs be used to improve customer satisfaction and retention for a service company?
By identifying areas for improvement and tracking advancement over time, KPIs can be utilized to enhance customer happiness and retention.
Tracking metrics like customer satisfaction scores, response times, and complaint resolution, for instance, can assist the business in determining where its efforts should be concentrated.
A service organization can increase client happiness and retention, which can result in higher revenue and profitability, by tracking these KPIs and making adjustments as needed.
4. What are some examples of KPIs that can be used to measure the efficiency and effectiveness of a service company's operations?
Service delivery time, first-time fix rate, employee utilization rate, and client acquisition cost are a few KPIs that can be used to gauge how effectively and efficiently a service company's operations are performing.
These KPIs offer information about the efficiency of the business's operations and can be used to spot potential areas for development, including streamlining customer service procedures or spending money on employee training.
5. How do you track and report on KPIs to ensure that they are being monitored and acted upon appropriately?
Establishing a precise procedure for data collection, analysis, and communication is necessary for tracking and reporting on KPIs. This could entail employing specialist software or tools, delegating tasks to particular people or teams, and setting up regular reporting schedules.
With each KPI, it's crucial to set specific objectives, monitor progress toward these objectives on a regular basis, and take action as necessary.
6. What role do KPIs play in the decision-making process for a service company?
KPIs help a service company's decision-making process by offering data-driven insights into essential areas of the organization. KPIs can be used to pinpoint areas of strength and weakness, monitor target progress, and offer benchmarks for comparison with peers or industry norms.
Service businesses can make better decisions about where to allocate resources and how to prioritize initiatives by using KPIs to guide decision-making.
7. How can KPIs be used to identify areas of opportunity and improvement for a service company?
By offering unbiased, data-driven insights into the company's performance, KPIs can be utilized to pinpoint areas for potential improvement.
For instance, if a KPI like client acquisition cost is higher than industry benchmarks, this would suggest that marketing techniques need to be reevaluated. Service providers can pinpoint areas where they can improve and create plans to seize growth opportunities by routinely tracking KPIs and examining patterns over time.
8. What are some best practices for setting and measuring KPIs for a service company?
Choosing KPIs that are pertinent and actionable, making sure KPIs are measurable and data-driven, monitoring progress frequently and making adjustments as necessary, and communicating KPIs and progress to pertinent stakeholders are some best practices for setting and measuring KPIs for a service company.
As well as being SMART (specific, measurable, achievable, relevant, and time-bound), KPIs must also be in line with the culture and values of the organization.
9. How do you ensure that KPIs are aligned with the company's overall strategy and goals?
Starting with a clear definition of the company's overarching strategy and goals is crucial to ensuring that KPIs are in line with them.
Then, KPIs should be chosen based on their capacity to track development toward these objectives and offer perceptions of the effectiveness of the strategy. KPIs should also be regularly reviewed to make sure they stay current and aligned with shifting business priorities.
10. What are some common pitfalls to avoid when using KPIs to measure the performance of a service company?
Selecting KPIs that are too general or generic, concentrating only on short-term performance at the expense of long-term growth, failing to regularly review and adjust KPIs based on changing business priorities, and using KPIs as a sole measure of success without taking other factors into account, such as employee satisfaction and customer loyalty, are common pitfalls to avoid when using KPIs to measure the performance of a service company.
In order to prevent data conflicts and erroneous interpretation, it's also critical to make sure that KPIs are measured and reported consistently.
From Tracking to Understanding the Professional Services KPIs
Teams involved in running service businesses can use the metrics discussed in this article to take the company's operation and performance to the next level. A good KPI for a service company can create a general positive brand image that goes beyond customer expectations.
If you liked this article about the KPI for a service company, you should also check out this one with service business examples.
We also wrote about similar topics like how to value a service business, how to start an answering service business, how to start a tree service business, the most profitable service businesses, home service businesses you can try, and the gross margin for service businesses.